MRI Spectroscopy
Voxel based Spectroscopy with MRI
Biomarker in MRI Spectroscopy
MRI Knowledge Hub
What is MRI Spectroscopy
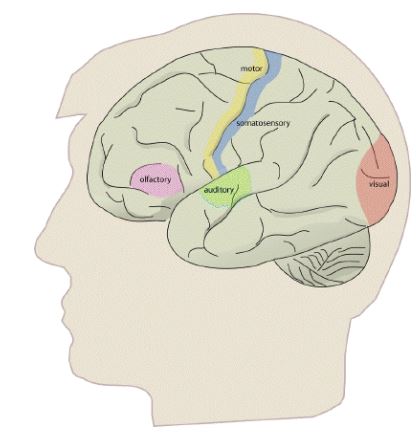
Functional magnetic resonance imaging or functional MRI (fMRI) measures brain activity by detecting changes associated with blood flow. The fMRI concept builds on the MRI scanning technology and the discovery of properties of oxygen-rich blood. MRI brain scans use a strong, permanent, static magnetic field to align nuclei in the brain region being studied. The central thrust behind fMRI was to extend MRI to capture functional changes in the brain caused by neuronal activity. Differences in magnetic properties between arterial (oxygen-rich) and venous (oxygen-poor) blood is mapped also called Bold Imaging.
Bold Imaging in MRI uses oxygenated vs non-oxygenated blood to map the cognitive-function/neuronal activity. Task or events by human body is initiated or controlled by neuronal activity, causing spatially-specific oxygen metabolic and physiologic consequences.
In other words Blood Oxygenation Level Dependent contrast is explored in functional MRI imaging to track human brain activity called Bold imaging.
Working of fMRI
The brain function study by fMRI is done by repeatedly imaging the brain. The subject is presented with a stimulus or required to carry out some task. The fMRI process for studying brain is dependent on three aspects; the pulse sequence used, the design of the stimulus paradigm, and the way the data is analysed. The magnitude of the static field (B0) used is critical to the percentage signal change obtained on activation. This is because susceptibility differences have a greater signal dephasing effect at higher fields. With the increase in field strength (B0) the magnitude of the BOLD contrast increases more rapidly than system noise, so it would appear that higher field strengths are desirable, however the image quality will be reduced at higher field. Today most researcher use EPI (Echo Planner Sequence) sequence, due to fast acquisition rate, which allows the activation response to short stimuli to be detected. EPI also has the benefit of reduced artefact from subject motion. To obtain the maximum signal change for a region with a particular value of T2*, the optimal value of echo time can be shown to be equal to the T2* value of that tissue. The contrast to noise ratio of the BOLD signal also depends on voxel size and slice thickness. Smaller voxels have less proton signal due to the reduced number of spins, however larger voxels may reduce the contrast to noise ratio by partial volume effects. This occurs if the signal changes on activation come from only a small region within the voxel, and so makes less of an impact on the total signal change in that voxel.
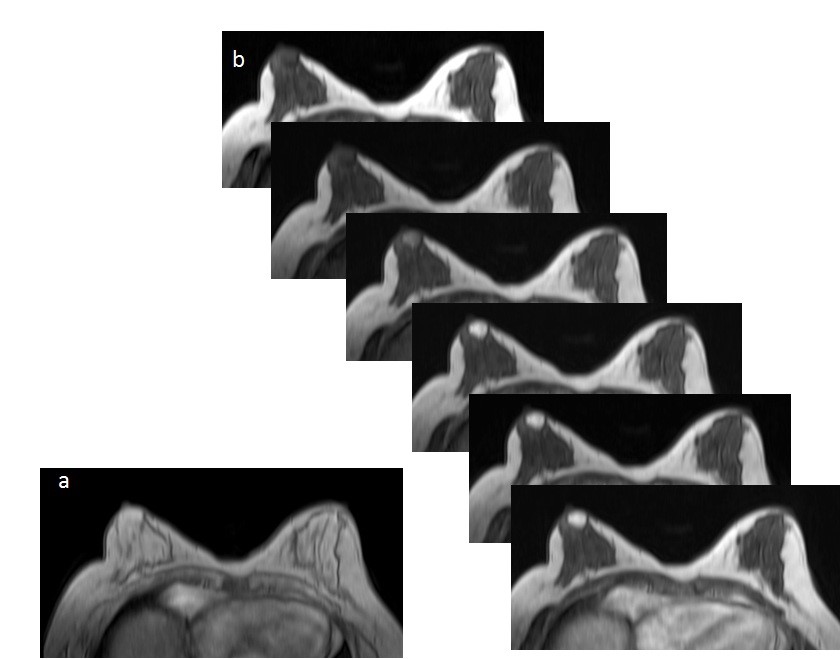
Today DCE-MRI plays an important role in cancer detection, characterization, stagging, and therapy monitoring/planning. Ktrans which is measure of capillary permeability calculated with DCE-MRI is used to delineate malignant cells.
Advantages OF DCE-MRI
- DCE-MRI is a non-invasive
- No Radiation
- High Spatial Resolution
- High Sinal to noise Ratio
- High Contrast to noise ratio
- High Sensitive to small vessel functions
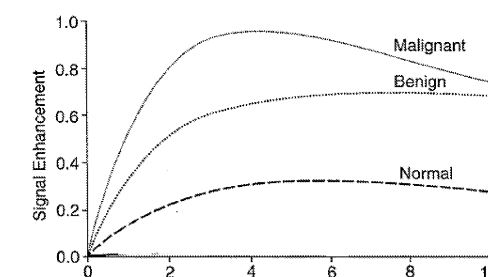
Figure 1: Time intensity curve for DCE-MRI Malignant (a) vs benign (b) tissue. Time intensity curve shows that the slope rise in case of malignant tissue is very sharp as compare to benign and normal tissue.